What Is a Stock? You Own a Piece of a Company, So What Happens Now?
You see headlines about the S&P 500, the FTSE 100, or the NGX All-Share every day, or maybe you just bought your very first share on an app and wondered what you actually hold. Here is the complete, plain-English guide to what owning stock really means, why prices move, and how your slice of a company pays you.

There is a strange, quiet anti-climax that catches almost everyone off guard the first time they buy a stock on a phone app. You transfer fifty or a hundred dollars from your paycheck, spend two or three days hesitating over whether you are making a mistake, and finally work up the courage to tap "Confirm Order." A green banner flashes across your screen: "Order Filled."
- 1A stock is legal business ownership, not a digital lottery ticket: When you buy a share, you purchase an enforceable fractional claim on a real, operating business, its equipment, its patents, and its future net profits.
- 2Your money rarely goes to the company when you buy on an app: Outside of an Initial Public Offering (IPO), everyday trades happen on the secondary market between ordinary investors, while the company focuses on running its business.
- 3Share price alone never tells you if a stock is cheap or expensive: A $10 stock can belong to a $200 billion corporate powerhouse while a $400 stock belongs to a much smaller firm; what matters is total Market Capitalization relative to actual earnings.
- 4Patience and reinvested dividends do the heavy lifting: Across nearly a century of verified market data, equities have returned roughly 9.9% annually on average, turning $1,000 into nearly $17,000 over thirty years when dividends are reinvested.
Then... absolutely nothing happens.
No certificate downloads to your camera roll. Nobody from corporate headquarters calls to welcome you to the company. Your cash balance drops to zero, a ticker symbol appears in its place, and twenty minutes later, your balance is suddenly sitting at forty-nine dollars and forty cents. You stare at that tiny red minus sign on a Tuesday morning with a sinking feeling in your stomach: Did I just lose money already? Did the market crash while I was not looking? Did I do something wrong?
If you spend any time browsing beginner investing forums or talking to people who started investing in recent years, you quickly realize that exact wave of disorientation is an almost universal rite of passage. Most trading apps are brilliant at designing slick buttons, but terrible at explaining what you actually hold in your hands once the order clears. You see friends posting charts on social media, you hear colleagues talk about dividends or stock splits at lunch, and every evening the news rattles off updates about the S&P 500, the FTSE 100 in London, or the NGX in Lagos as if everyone watching was born with a finance degree. If you don't work in banking, those headlines sound like weather reports from another planet.
Yet behind all the Wall Street jargon sits one of the simplest, oldest, and most practical wealth-building tools ever created. You don't need to be a math genius, and you certainly don't need to work in finance, to understand how stock ownership works. Once you strip away the acronyms bankers use to make things sound complicated, the entire global market operates on the exact same common-sense principles as a corner grocery shop.
This deep dive is built for anyone who wants the complete, unvarnished picture. We will walk through what a stock actually is, why everyday brands you already pay each month are owned by millions of ordinary people, what happens to your cash the second after you buy, how to read any stock quote screen in sixty seconds, why prices bounce around on ordinary afternoons, and how to start safely whether you live in Lagos, London, Mumbai, New York, or Johannesburg.
What a Stock Actually Is: The Neighborhood Bakery Example
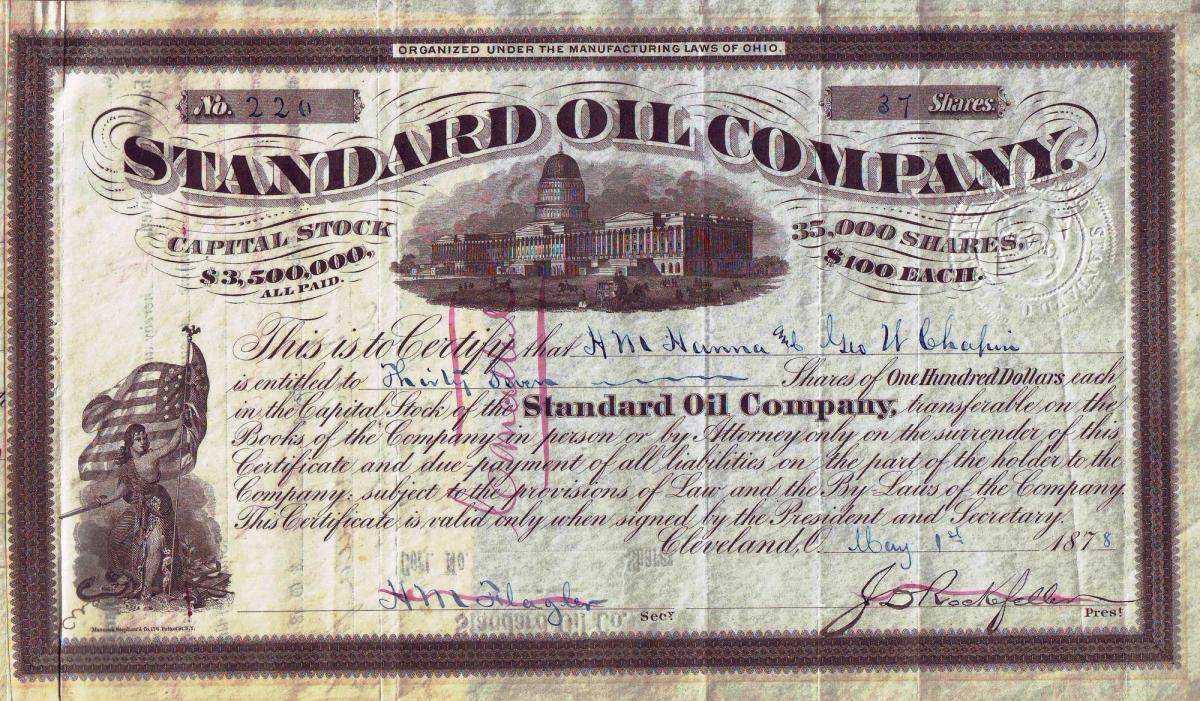
Strip away the blinking red and green numbers on trading screens, and a stock is simply a unit of legal ownership in a real business. Financial writers and commentators often use the words stock, share, and equity interchangeably, which confuses beginners right away. Here is the straightforward distinction: "equity" is the concept of ownership itself, "stock" refers to corporate ownership in general ("I own stock in car manufacturers"), and a "share" is the specific, countable slice you hold ("I own 15 shares of Toyota").
To see how a share comes into existence without touching any Wall Street terminology, imagine your cousin Amara runs the most popular bakery in your city. Her ovens run from before dawn until midnight, local cafes line up to buy her sourdough wholesale, and an independent accountant values her entire business (the commercial ovens, the delivery van, the recipes, and the cash register) at $100,000. Now Amara wants to open a second location across town. She calculates that leasing the new storefront, installing modern ovens, and hiring four full-time bakers will cost $40,000 upfront.
Amara sits down at her kitchen table and realizes she has only two realistic ways to raise that $40,000:
- Path A: Borrow the money through a bank loan (Debt). She can walk into a commercial bank and take out a $40,000 business loan. The bank doesn't care whether her bread is delicious or whether construction takes longer than expected; the bank demands fixed monthly repayments plus 12% or 18% annual interest, starting immediately. If flour prices double or foot traffic starts slow and Amara misses her loan payments, the bank can legally seize her equipment and shut down the bakery.
- Path B: Sell slices of ownership in the business (Equity). Instead of taking on stressful debt, Amara decides to divide the legal ownership of her $100,000 bakery into 1,000 equal pieces called shares. Each share represents exactly 0.1% (one-thousandth) of the entire business and carries an initial price of $100.
Amara keeps 600 shares (60% of the company) so she remains the majority owner and boss who makes the daily business decisions. She sells the remaining 400 shares (40% of the company) to neighbors, family members, and local customers for $100 per share. By selling those 400 shares, she raises the exact $40,000 she needs to open the second bakery. Best of all, she owes zero monthly interest payments to a bank. Her new shareholders understand that they only profit if the bakery itself succeeds.
Now suppose you take $1,000 of your savings and buy 10 of Amara's shares. The moment that transaction is recorded, your relationship to the bakery changes completely. You aren't just a customer buying a loaf of bread anymore. You legally own 1% of the entire two-store company. You own 1% of the ovens, 1% of the delivery vans, 1% of the brand reputation, and 1% of every single dollar of net profit left over after paying the bakers, the flour suppliers, the landlords, and the tax authorities.
Every publicly traded company on earth operates on the exact same model as Amara's bakery. The only difference is scale. Instead of dividing a $100,000 neighborhood shop into 1,000 shares, a global enterprise divides a $50 billion or $3 trillion business into billions of tiny shares so that anyone with $20 or $50 can become a part-owner.
What surprises many people when they start paying attention to markets is realizing just how many products they touch every single morning belong to publicly traded corporations. You might wake up to an alarm on an Apple iPhone, brew coffee or grab a drink from Coca-Cola, commute in a Toyota, work on a laptop running Microsoft software while streaming music on Spotify, and unwind in the evening watching a documentary on Netflix.
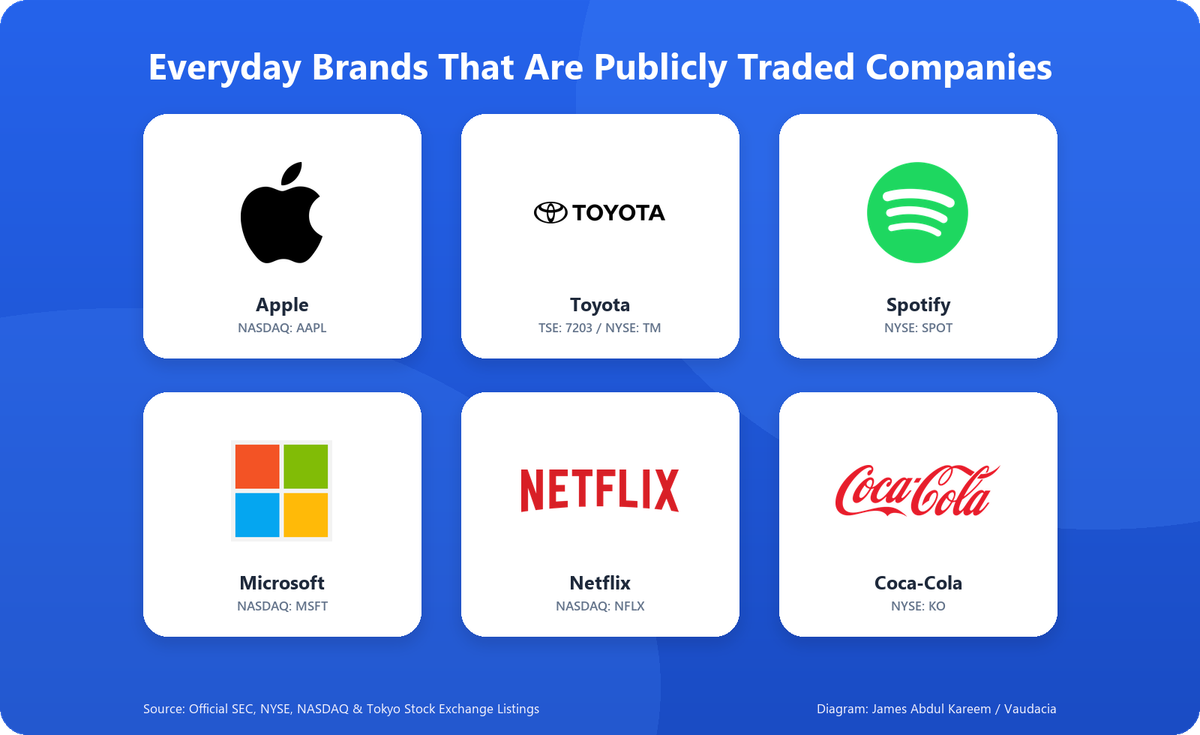
None of these six corporations is owned by a single reclusive billionaire. They are owned by millions of everyday people, retirement funds, teachers' pension plans, and retail investors who bought shares on a public exchange. When you pay your monthly subscription or buy their products, a small portion of that revenue flows directly down to the people who hold the stock.
Wait: When You Buy a Stock on Your Phone, Does the Company Get Your Money?
Before looking at what your shares actually do inside your account, let's tackle one of the most common misunderstandings among new investors: when you buy a share of stock on an app, where does your cash actually go?
A lot of beginners assume their money gets wired straight into the company's bank account to help them hire engineers or build new factories. But in reality, your money almost never goes to the company. To understand why, you need to picture the stock market as two completely separate rooms: the Primary Market and the Secondary Market.
1. The Primary Market (The IPO)
Think back to Amara's bakery. The day Amara first created those 400 new shares and sold them to raise $40,000 for her second store, that money went straight into the bakery's bank account. In the corporate world, when a private company decides to offer shares to the public for the very first time, that event is called an Initial Public Offering (IPO). During an IPO (or a rare follow-on share issuance later on), the company creates brand-new shares and sells them to raise capital for factories, research, or debt repayment. That is the Primary Market, and it only happens occasionally.
2. The Secondary Market (Where 99.9% of Trades Take Place)
Now fast-forward two years. Suppose one of Amara's original investors, a neighbor named David who bought 10 shares during the initial offering, needs cash to pay for home repairs. Amara can't pull money out of the bakery's ovens to pay David back. Instead, David finds you, and you agree to buy his 10 shares for $1,300. You hand the cash to David, and David transfers his 10 shares to your name on the company's shareholder ledger. Amara's bakery doesn't receive a single cent from that transaction, yet you now step into David's shoes as the legal owner of that 1% stake.
That peer-to-peer exchange is the Secondary Market. When you open your brokerage app on a Thursday afternoon and buy a share of Apple, Microsoft, Shell, or Dangote Cement, you aren't buying it from the company. You are buying an existing share from another investor somewhere in the world who decided to sell at that exact second. The stock exchange (whether it is the New York Stock Exchange, Nasdaq, the London Stock Exchange, or the Nigerian Exchange) acts as the high-speed matching engine that pairs your buy order with someone else's sell order in a fraction of a second.
Why does a company care about its stock price if it isn't collecting cash from daily trades? For three critical reasons:
- The company can issue fresh shares when needed: When a company's stock price is high, it can issue a small batch of new shares on the primary market to raise billions of dollars very cheaply, or use its valuable stock as currency to acquire competing businesses.
- Executive and employee compensation is tied to stock: A massive portion of compensation for leaders and key staff comes in company shares. If the stock performs poorly, top talent walks out the door to join competitors.
- Management works for the owners: Because shareholders elect the Board of Directors, a management team that allows the business to drift and the stock price to tank can be voted out and replaced by frustrated owners.
You Own a Piece of the Company. So What Happens Now?
Now let's answer the central question: once your trade settles and the app confirms you own 5 shares of a company, what does that ownership actually give you? You can't walk into corporate headquarters, pick up an office monitor, and carry it out the door claiming it belongs to you. A corporation is an independent legal entity that holds title to its own physical property. Instead, securities law grants you five specific, enforceable rights the moment your purchase settles.
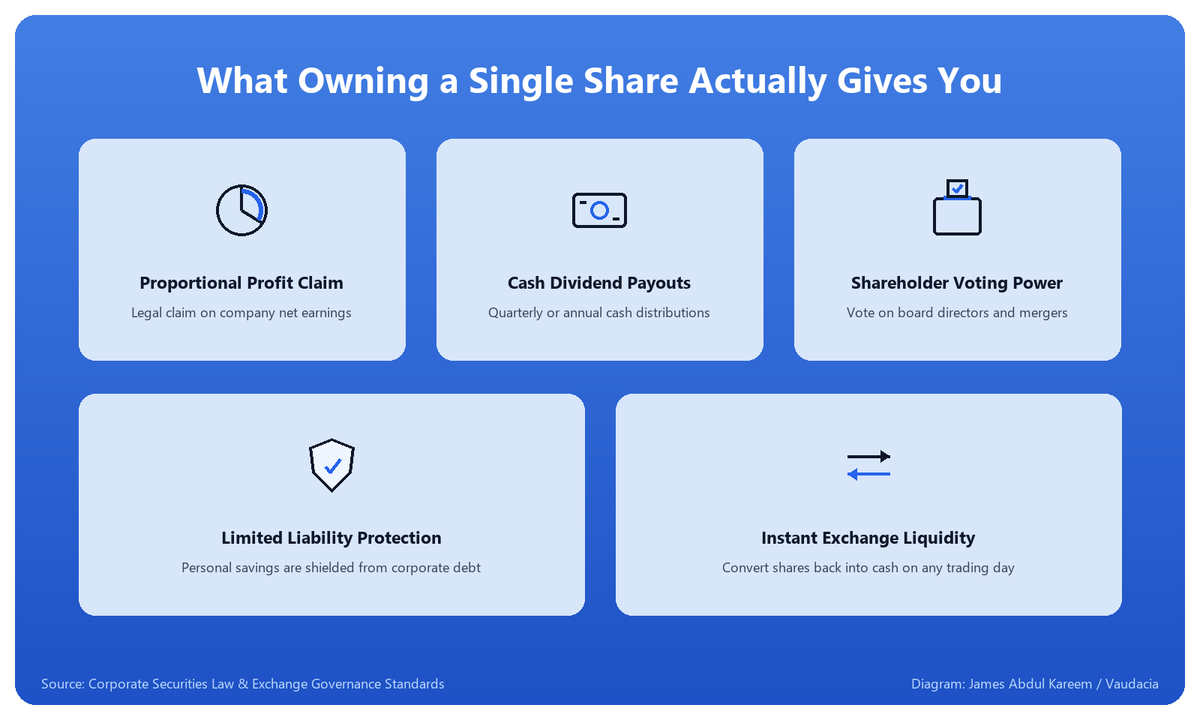
Review standard corporate charters and securities regulations across major bodies like the US SEC, the UK Financial Conduct Authority, the Securities and Exchange Board of India, and the Nigerian Exchange Group, and you'll find these same five rights form the bedrock of equity ownership everywhere:
1. A Proportional Claim on Future Net Profits: Every dollar the company earns after paying staff salaries, vendor bills, debt interest, and corporate taxes belongs to the shareholders. Even when management chooses not to send you cash this quarter and instead reinvests profits into building new facilities or developing new products, the net asset value behind each of your shares expands.
2. Cash Dividends (Direct Profit Payouts): Established, consistently profitable companies frequently take a portion of their earnings and distribute it directly to shareholders as cash. You don't need to sell any shares or fill out paperwork. If a company announces a $0.80 quarterly dividend per share and you own 50 shares, $40 in cash simply lands in your brokerage account balance on the payment date.
3. Voting Power at Annual General Meetings (AGMs): When you hold Common Stock (the standard shares everyday investors buy), you receive an electronic proxy ballot by email before the company's annual shareholder meeting. Each share carries voting weight. You get a voice on who sits on the Board of Directors, whether executive pay packages are reasonable, who audits the accounts, and whether major mergers should be approved. (Some corporations also issue Preferred Stock, which usually skips voting rights but pays a fixed, priority dividend ahead of common shareholders.)
4. The Protection of Limited Liability: Legal scholars often describe limited liability as one of the most transformative legal innovations of the modern era. If you operate an unincorporated sole proprietorship and your business goes bankrupt owing $400,000, creditors can pursue your personal savings, your vehicle, and your home. With a publicly traded corporation, your liability is strictly capped at the amount you invested. If you put $150 into an airline that collapses under $10 billion in debt, creditors cannot demand a single penny from you. The absolute worst mathematical outcome of an unleveraged stock investment is that the price drops to zero and you lose the $150 you put in.
5. Immediate Exchange Liquidity: If you put $5,000 into a friend's private catering startup or purchase a plot of land, turning that investment back into cash during an emergency can take months of stressful negotiations, broker fees, and price concessions. With a publicly listed stock, the exchange provides a continuous pool of buyers every business day. You can tap "Sell" on your phone during market hours and convert your shares back into cash within seconds.
How a Stock Puts Money in Your Pocket (And How You Can Lose It)
Once you hold shares in your portfolio, there are only two primary ways that investment ever puts real cash in your pocket: capital appreciation (the share price climbs above what you paid) and dividends (cash payouts from company profits). A third mechanism, share buybacks, works quietly behind the scenes to support both. Every single one of these relies on the same core engine: a company providing products or services that customers gladly pay for at a healthy profit.
Let's see how all three work in practice with clean, round numbers. Suppose Amara's bakery business wraps up an exceptional year. After paying for flour, rent, staff wages, utilities, and corporate taxes, the company has $20,000 in net profit sitting in its business account. Because there are 1,000 total shares, the company generated exactly $20 of profit per share. On financial websites and earnings reports, that metric is called EPS (Earnings Per Share), and it's the foundational pulse of the entire stock market.
Amara and her board now have three distinct choices for how to use that $20,000 net profit:
- They pay a Cash Dividend: They choose to distribute $5,000 directly to shareholders, which comes out to $5 per share. Since you own 10 shares, $50 in cash drops straight into your account. Understanding the dividend timeline is simple: the company announces the payout on the Declaration Date and establishes a cutoff called the Ex-Dividend Date. If you own the stock before the Ex-Dividend Date, you are legally entitled to receive the cash on the Payment Date, even if you sell the shares the following week.
- They Reinvest for Capital Appreciation: They direct $10,000 of the profit into buying two refrigerated delivery vans so they can supply twenty supermarkets across the region. Because the company now owns more productive assets and is on track to earn $30,000 next year instead of $20,000, outside buyers want in. They bid the share price up from the $100 you paid to $140 per share. Your 10 shares are now worth $1,400.
- They Execute a Share Buyback: What if Amara takes the remaining $5,000 in corporate cash to buy back 50 shares from an early investor who wants to cash out, and then retires those shares permanently? Now there are only 950 shares left in the company instead of 1,000. Without you spending an extra dime, your 10 shares just went from representing 1.00% of the business to 1.05%. Because the corporate pie has fewer slices, every remaining share automatically commands a slightly larger piece of future profits. Tech and consumer giants like Apple, Microsoft, and Visa spend tens of billions every year buying back their own shares for this exact reason.
Now let's talk openly about the flip side: how do people lose money in stocks? In practice, losses usually boil down to one of two causes. First, the underlying business can genuinely fail: a competitor invents a superior alternative, leadership mismanages debt, or customer preferences shift permanently. If a business loses its earning power year after year, the stock price will eventually reflect that decline.
Second, and far more common for beginners, people lose money by buying a stock during a wave of social media euphoria at an inflated valuation, and then panic-selling during a routine market pullback. This brings us to a fundamental concept every investor needs to understand: the difference between an unrealized loss and a realized loss.
If you buy 10 shares at $100 each ($1,000 total) and an unsettling headline causes the share price to dip to $85 next month, your account balance will show $850, down $150. That temporary drop is an unrealized loss (often called a "paper loss"). Nobody took your shares away. You still own the exact same 10 shares, and those shares still collect dividends and represent the exact same proportion of the business. That paper dip only transforms into a permanent, realized loss if you panic and tap "Sell" at $85. When you own strong, cash-generating businesses, temporary price swings are simply the weather of the market, not a permanent loss of capital.
The $5 Stock Illusion: Why Share Price Does Not Equal Company Size (And How Stock Splits Work)
Look through beginner investing forums and question threads, and one costly misunderstanding appears constantly. New investors frequently glance at Company A trading at $12 per share and Company B trading at $450 per share and think: "Company A is so much cheaper! It has way more room to double from $12 to $24 than Company B does from $450 to $900."
That is a total optical illusion. Judging a company's size or value purely by the price of a single share is like asking how much a pizza costs, hearing "Each slice is $2," and concluding it is cheap without checking whether the pizza was divided into 4 giant slices or 64 tiny strips.
To know what a company is actually worth on the market, you must multiply two numbers together:
Share Price × Total Number of Shares Outstanding = Market Capitalization (Market Cap)
Look at real exchange data side by side, and the contrast becomes obvious. Suppose Global Bank Corp has 10 billion shares in existence, trading at $20 each. Its total Market Cap is $200 billion. Meanwhile, suppose Regional Software Inc has only 5 million shares in existence, trading at $300 each. Its total Market Cap is just $1.5 billion. Even though Global Bank's share price looks tiny at $20 and Regional Software's looks expensive at $300, Global Bank is actually 133 times larger than Regional Software!
Why Companies Split Their Stock (And Why It Doesn't Make You Richer)
Once you grasp the pizza-slice principle, you also understand Stock Splits, which generate headlines whenever popular companies like Nvidia, Apple, Tesla, or Walmart announce one. Over years of steady growth, a successful firm's share price might climb from $50 to $1,000 per share. At $1,000, smaller retail investors whose local brokerages don't support fractional shares might find it cumbersome to buy a single share.
So the board announces a 10-for-1 stock split. Over the weekend, each 1 share you owned at $1,000 is replaced in your account with 10 shares priced at $100 each. What was your portfolio worth before the split? $1,000. What is it worth the next morning? 10 × $100 = $1,000. Nothing about the company's overall value, its profits, or your fractional ownership changed. The company simply cut the same pizza into smaller slices so the price per slice looks more accessible on a phone screen.
So how do you actually tell if a stock is cheap or expensive? Instead of focusing on the share price, experienced investors look at the Price-to-Earnings Ratio (P/E Ratio). You find it by dividing the Share Price by the annual Earnings Per Share (EPS) (or total Market Cap divided by total annual profit). If a stock trades at $100 and generates $5 per share in annual net profit, its P/E ratio is 20 ($100 divided by $5). In plain English, a P/E of 20 means investors are paying $20 today for every $1 of annual profit the business produces. Comparing P/E ratios across companies in the same sector quickly shows whether you are paying a bargain price or paying a hefty premium for future expectations.
How to Read Any Stock Quote on Google or Yahoo Finance in 60 Seconds
One of the most useful habits you can build is typing a company's name followed by the word "stock" into a search engine (for example, "Toyota stock" or "Microsoft stock") and checking the summary box that appears. To a beginner, the row of metrics beneath the chart looks like an airplane instrument panel. Keeping a quick reference handy helps until decoding those numbers becomes second nature.
Here is a plain-English translation table for the essential metrics you see on any standard stock quote:
Next time a company comes up in conversation or on a podcast, pull up its quote card and take sixty seconds to scan Market Cap, EPS, P/E Ratio, and Dividend Yield. Those four metrics alone provide a far more realistic picture of the business than hours of social media commentary.
Why Stock Prices Move Every Second (And What Bull vs. Bear Markets Mean)
Here is a question that naturally occurs to anyone watching a trading screen: if a company only releases its audited financial results once every three months, why does its share price fluctuate every three seconds between Monday morning and Friday afternoon?
Because during active market hours, a stock exchange operates as a continuous, live auction where millions of buyers, sellers, and automated systems are constantly updating their view of the future. At any given moment in the order book, two prices sit side by side:
- The Bid Price: The highest price an active buyer is willing to pay right now (for instance, $99.98).
- The Ask (or Offer) Price: The lowest price an active seller is willing to accept right now (for instance, $100.02).
That four-cent gap between buyer and seller is known as the Bid-Ask Spread. For massive, highly liquid companies like Apple or Microsoft, millions of shares change hands every hour, keeping the spread down to a penny or two. For smaller or less actively traded stocks, the spread can be noticeably wider. When optimistic buyers outnumber sellers and agree to pay the asking price, the ticker ticks up. When sellers become eager to exit and take lower bids, the ticker ticks down.
Zooming out from minute-by-minute fluctuations, four broader forces shape market directions over weeks and months:
- 1. Quarterly Results vs. Expectations: This explains why market reactions can look baffling at first. A company can report that its quarterly profit jumped 25% to an all-time high, yet its stock drops 8% the next morning. Why? Because investors had already bid up the stock anticipating a 35% jump, or because leadership cautioned that the upcoming quarter looked slower. Stocks don't move simply on whether news is "good" or "bad"; they move on whether it is better or worse than what was already priced in.
- 2. Interest Rates and Bond Yields: Equities don't exist in a bubble; they constantly compete with government bonds for investor capital. When central banks keep interest rates rock-bottom, bonds pay very little, making stocks the most appealing game in town. But when interest rates rise and risk-free government bonds offer attractive yields, large institutions demand a discount on stocks before taking on business risk. As explored in Why a Five Percent Bond Yield Breaks the Case for Stocks, rising bond yields exert steady downward gravitational pull on stock valuations.
- 3. Commodity, Currency, and Supply Shocks: Real-world economic events impact industries differently. A jump in oil prices boosts petroleum companies while squeezing airlines whose primary operating cost is fuel. In economies with floating currencies, a sudden currency drop makes imported raw materials more expensive for domestic manufacturers.
- 4. Market Cycles: Bull Markets, Bear Markets, and Corrections: Legendary investor Benjamin Graham famously noted that in the short run, the market is a voting machine driven by sentiment and emotion, but in the long run, it is a weighing machine that measures actual business earnings. When optimism dominates and the broad market climbs steadily over months or years, it is called a Bull Market (symbolized by a bull thrusting upward). When pessimism takes over and an index drops 20% or more from its recent peak, it is officially classified as a Bear Market (symbolized by a bear swiping downward). A shallower pullback of 10% to 19% is known as a Correction.
Reviewing market data across nearly a century reveals a comforting reality for beginners: 10% market corrections happen roughly every year or two on average, and 20%+ bear markets occur roughly every five to seven years. They aren't unexpected catastrophes; they are simply the normal entry fee you pay for earning higher long-term returns than savings accounts. Every bear market in modern history has eventually given way to recovery as businesses adjusted, reduced costs, innovated, and drove profits to new peaks.
The Proof in the Data: What Happens to $1,000 Over 30 Years
Why endure market pullbacks, headlines, and volatility at all when you could just leave your money in cash or short-term treasury bills? The answer becomes undeniable when you look at the numbers across full decades.
Long-term return data compiled by Professor Aswath Damodaran at NYU Stern School of Business, tracking annual returns from 1928 through 2025, shows a dramatic gulf between owning businesses (equities) and lending money (bonds and cash bills).
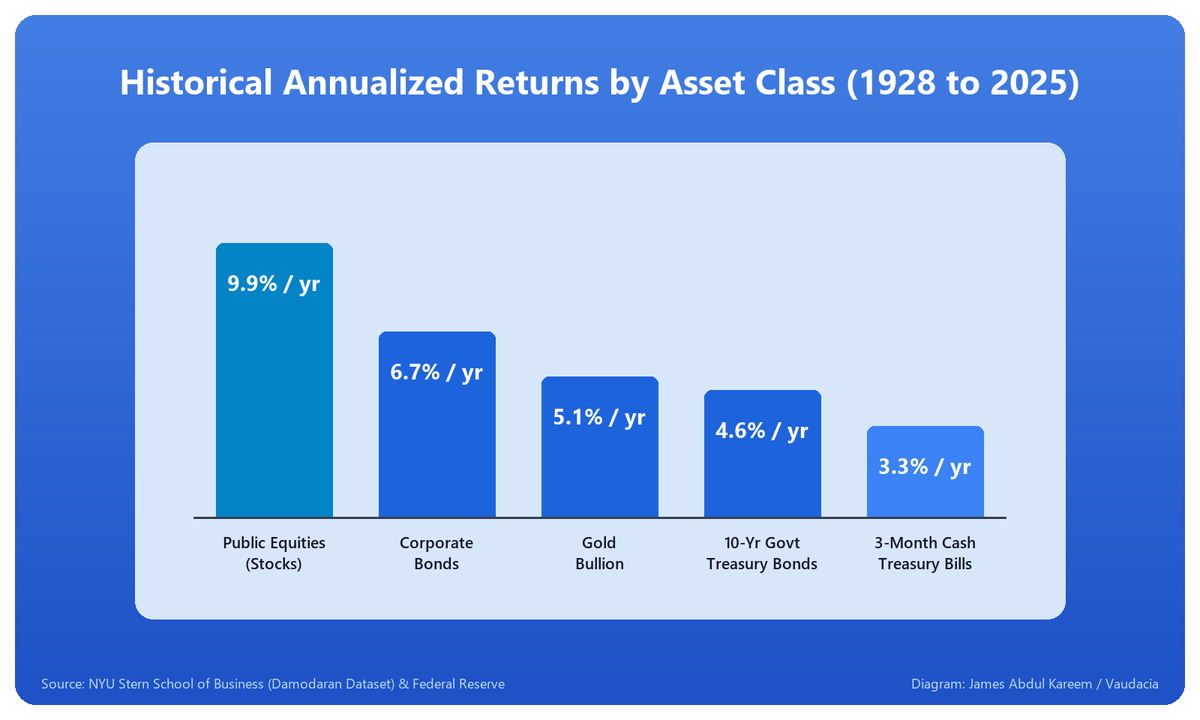
At first glance, the gap between 3.3% per year (3-Month Treasury Bills), 4.6% per year (10-Year Government Bonds), and 9.9% per year (Public Equities with dividends reinvested) might not look dramatic. But when those annual rates compound year after year for three decades, the outcome is the difference between barely preserving your savings and building genuine financial freedom.
To see this clearly, look at what happens to an initial $1,000 investment left untouched for 30 years across five common approaches:
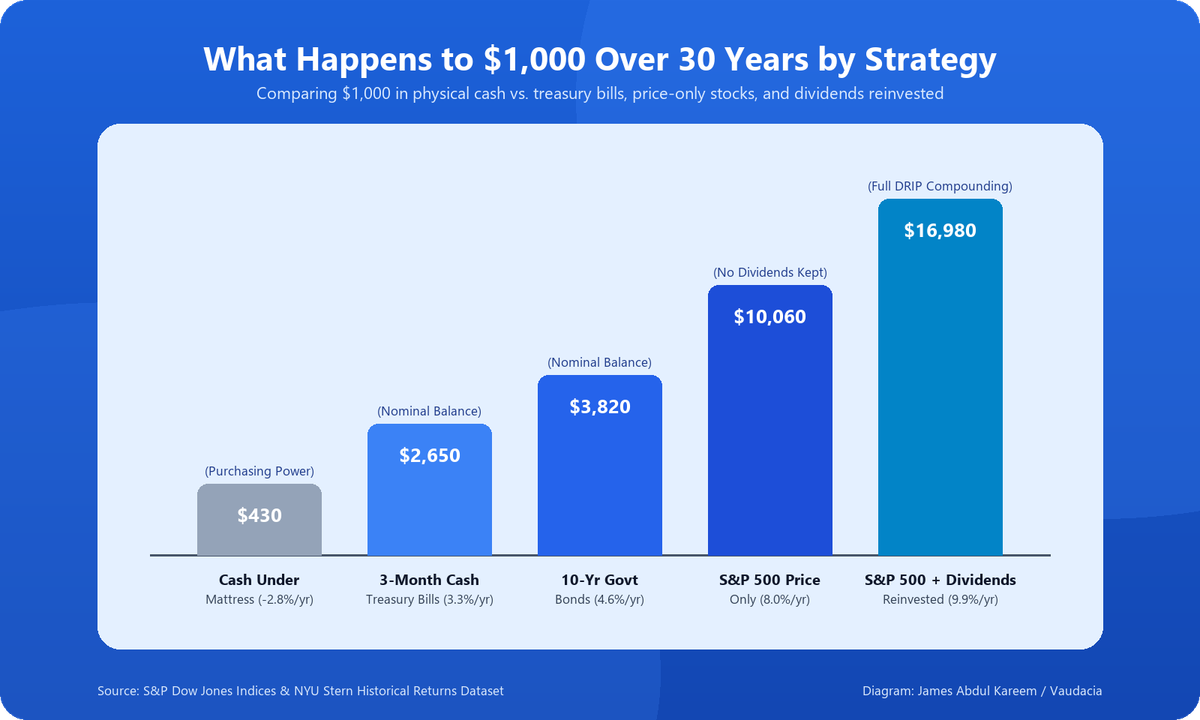
Notice the two bars on the right side of the visual. If you invested $1,000 in an S&P 500 index thirty years ago and withdrew every dividend check to spend immediately, the rising share prices alone (~8.0% per year) grew that $1,000 to $10,060. But if you enabled the free feature in your account to automatically reinvest those dividends into additional fractional shares (known as DRIP, or Dividend Reinvestment Plan), those newly acquired shares generated their own dividends, compounding steadily through market highs and lows. Over thirty years, that loop brought the total to $16,980, adding nearly $7,000 in extra growth from the exact same starting amount.
Now look at the gray bar on the far left. People who park all their long-term money in cash often reassure themselves: "At least I can't lose money in cash." On paper, your original bills still show $1,000 thirty years later. But against an average inflation rate of roughly 2.8% per year, the actual buying power of that $1,000 drops to $430. Cash is ideal for handling expenses over the next few months, but over a multi-decade horizon, uninvested cash steadily surrenders purchasing power.
Take note of the final row in that table: Best Time Horizon. Money you will need for rent next month, school tuition this year, or an emergency reserve should never be placed in the stock market, because no one can forecast what prices will do over a six-month window. That is why building an accessible liquid cash cushion first, using the blueprint in How to Build a One-Month Cash Buffer on Any Income, is always step zero before buying your first share.
Where Stocks Live: Global Exchanges and What "The S&P 500" Actually Means
Mainstream financial coverage often speaks as though the United States is the only market that exists. In truth, almost every major economy runs a regulated national stock exchange where domestic enterprises raise capital and citizens invest.
What about the headline terms you hear on the news every day: the S&P 500, the Dow Jones, the Nasdaq, the FTSE 100, the Nikkei 225, the NGX All-Share, the Nifty 50, or the JSE Top 40?
These are Stock Market Indexes (or indices). Think of an index as a thermometer for a market. With thousands of companies listed across an exchange, reviewing every single one each day would be impossible. So index creators (such as S&P Dow Jones in New York, FTSE Russell in London, or the Nigerian Exchange in Lagos) assemble a basket of the largest, most established firms on that exchange into a single tracked figure:
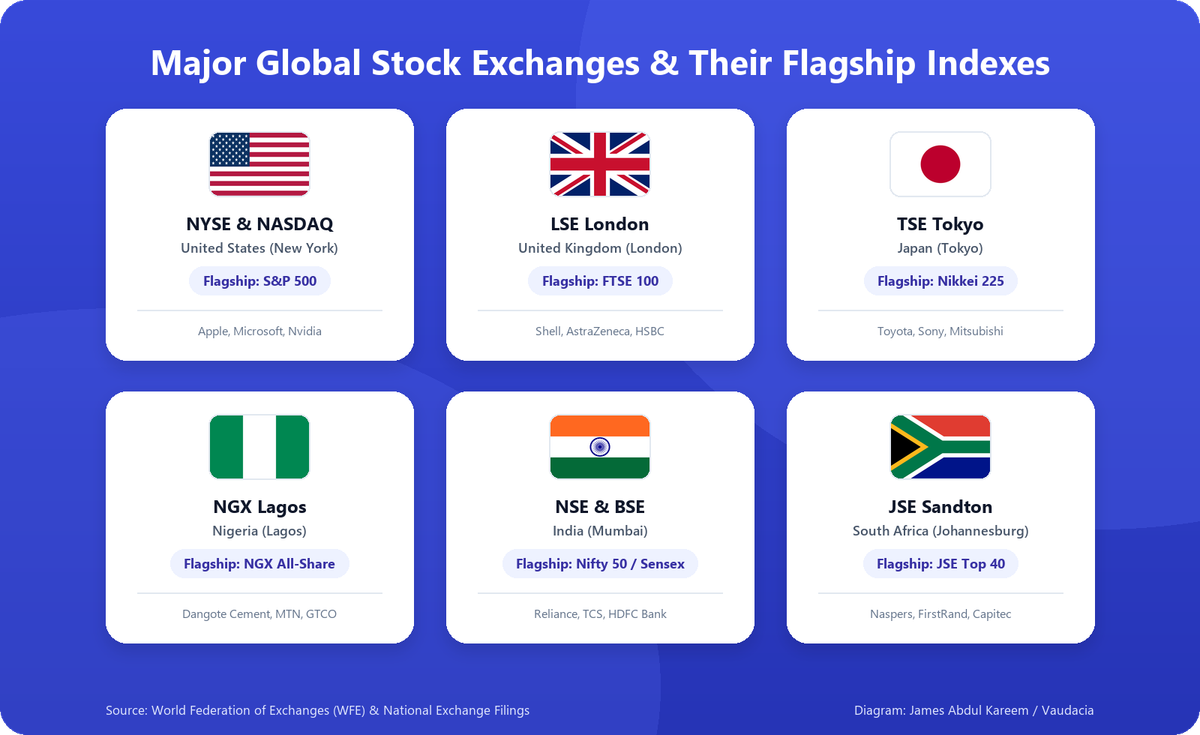
- The S&P 500 (United States): Follows 500 of the largest, profitable public corporations listed on the NYSE and Nasdaq, including Apple, Microsoft, Nvidia, Amazon, Alphabet (Google), and JPMorgan Chase. Together, these 500 companies account for roughly 80% of the total US stock market valuation.
- The FTSE 100 (United Kingdom): Pronounced "Footsie 100," this tracks the 100 largest firms by market cap on the London Stock Exchange, including Shell, AstraZeneca, HSBC, Unilever, and BP.
- The Nikkei 225 (Japan): Follows 225 prominent blue-chip companies on the Tokyo Stock Exchange, featuring manufacturing and tech icons like Toyota, Sony, Mitsubishi, and Hitachi.
- The NGX All-Share Index (Nigeria): Reflects the broad equity market on the Nigerian Exchange in Lagos, anchored by major players like Dangote Cement, MTN Nigeria, Airtel Africa, BUA Foods, and Guaranty Trust Holding Company (GTCO).
- The Nifty 50 & BSE Sensex (India): Track the leading corporations across India's National Stock Exchange (NSE) and Bombay Stock Exchange (BSE) in Mumbai, including Reliance Industries, Tata Consultancy Services (TCS), and HDFC Bank.
- The JSE Top 40 (South Africa): Tracks the 40 largest listed corporations on the Johannesburg Stock Exchange in Sandton, the largest exchange on the continent, including Naspers, FirstRand, Standard Bank, and Capitec.
The Smart Investor's Shortcut: Index Funds and ETFs
Understanding what an index is leads directly to one of the most liberating truths in investing: you don't have to spend your weekends trying to guess which individual company will win over the next twenty years.
Picking single stocks demands serious research. Even dominant market leaders can struggle if technology passes them by (think of what smartphones did to traditional camera makers or early mobile phone giants). Putting your life savings into just one or two companies leaves you exposed to management missteps or sudden industry shifts.
Instead of betting on whether Apple, Microsoft, Toyota, or another firm will dominate the decade, you can buy a single share of an Index Fund or ETF (Exchange-Traded Fund). An ETF trades on the exchange just like an individual stock, but one share of an S&P 500 ETF (such as Vanguard's VOO or iShares' IVV) automatically holds tiny, proportional slices of all 500 companies in the index at the exact same time.
Even better, an index is self-updating. If a company loses its competitive edge and shrinks over the years, the index committee removes it and promotes the next growing, profitable business that qualifies. You don't have to do anything. That is why S&P Dow Jones' SPIVA scorecards consistently reveal that over 15-year and 20-year horizons, a basic low-cost index fund outperforms more than 85% of active professional fund managers who spend sixty hours a week trying to outsmart the market.
How to Actually Buy Your First Stock Without Getting Burned
Decades ago, buying a stock involved phoning a human stockbroker, paying a steep commission, and waiting days for paper confirmations in the mail. Today, anyone with a smartphone, an official ID, and $20 can open a regulated brokerage account and purchase fractional shares in minutes.
However, looking at the apps aggressively marketed on social media reveals a subtle trap that frequently trips up beginners before they even realize what happened.
Once you've confirmed that you're working with an officially licensed broker in your jurisdiction (such as firms regulated by the SEC/FINRA in the US, the FCA in the UK, the SEC/NGX in Nigeria, SEBI in India, or the FSCA in South Africa), follow this five-step checklist for your first investment:
- Step 1: Verify Your Emergency Savings First. Only invest money you won't need for everyday living costs, rent, or emergencies over the next three to five years. Having a separate high-yield cash cushion prevents you from ever being forced to sell shares during a temporary downturn to cover an unexpected expense.
- Step 2: Start With a Broad Core ETF (The 80/20 Approach). For a steady, low-stress foundation, allocate 80% to 90% of your portfolio to a low-cost broad index ETF (tracking the S&P 500, a total world index, or your domestic market). Then, if you enjoy analyzing businesses, use the remaining 10% to 20% to invest in individual companies whose products and financials you understand well.
- Step 3: Check Foreign Exchange and Spread Costs. Apps that promote zero commissions often make their money on currency conversion markups or wide bid-ask spreads when converting local currency into US dollars or pounds. As demonstrated with complete fee calculations in The 3% Tax Hiding Inside Dollar-Cost Averaging, paying 1.5% in FX fees on small recurring deposits quietly eats into your early returns. Review your broker's fee schedule before transferring funds.
- Step 4: Use a "Limit Order" Rather Than a Blind "Market Order". When you tap "Buy," look for the order type option. A Market Order tells the broker: "Buy this right now at whatever price the seller wants." If you place a Market Order outside regular hours or during a volatile opening bell, you might get filled at a brief price spike. A Limit Order lets you set the maximum price you're willing to pay per share. Your order will only execute at your chosen price or better.
- Step 5: Understand the Tax Basics, Enable DRIP, and Step Away. In almost all countries, you owe zero capital gains tax simply because your shares increased in value inside your account (an unrealized gain); taxes only apply when you actually sell for a profit. (If you live outside the US and invest in US stocks, your broker will prompt you to complete a brief digital W-8BEN form so you are taxed correctly on dividends as a non-resident.) Turn on automatic dividend reinvestment (DRIP), establish a steady monthly routine if you plan to invest regularly, and resist the temptation to check the app multiple times a day.
That early nervous habit, reopening your brokerage app every twenty minutes just to see if your balance moved by forty cents, fades the moment you understand what you actually hold. A stock isn't a digital roulette wheel or a meaningless line dancing on a smartphone screen. It's a legal deed to an operating business where thousands of engineers, logistics managers, designers, and salespeople wake up every morning to create value, serve customers, and grow earnings. You own a slice of it now. Let the business do the work.
Disclaimer: This article is for educational and informational purposes only and does not constitute personalized financial, investment, legal, or tax advice. Past historical performance does not guarantee future results. Always verify broker licensing with your national regulator before investing.
Frequently Asked Questions
How much money do I actually need to buy my first stock?
You do not need thousands of dollars. Most modern regulated brokerages offer fractional shares, which allow you to buy a slice of an expensive stock or index ETF for as little as $5 to $20 (or the equivalent in your local currency). However, always check if your broker charges a flat minimum transaction fee, as paying a $2 fee on a $10 purchase immediately costs you 20%.
What happens to my shares if the brokerage app I use shuts down?
If you use a properly regulated stockbroker, your shares are not mixed with the broker's own corporate bank account. By law, client shares are held separately at a central depository or custodian (such as the DTCC in the US, CREST in the UK, or CSCS in Nigeria) and protected by investor compensation schemes (like SIPC in the US or FSCS in the UK). If the app goes out of business, your shares are transferred to another licensed broker.
Can I buy US or global stocks if I live outside the United States?
Yes. Investors in Nigeria, the UK, India, South Africa, Europe, and across Asia can legally buy US and international equities either through international brokerages (such as Interactive Brokers, Trading 212, or local SEC-registered partner apps) or by buying globally diversified ETFs listed on their home or European exchanges. Non-US residents typically fill out a standard W-8BEN tax form inside the app so they are only taxed appropriately on dividends.
Do I owe taxes when my stock goes up in price?
In almost all tax jurisdictions, you do not pay capital gains tax simply because the price of your stock rose inside your account (an unrealized gain). Capital gains tax is only triggered when you actually sell the shares for more than you paid (a realized gain). Cash dividends, however, are generally taxable in the year they are paid to you unless held inside a tax-sheltered retirement or ISA account.
What is the difference between Common Stock and Preferred Stock?
When people talk about buying stocks, 99% of the time they mean Common Stock, which gives you voting rights and full participation in the company's growth. Preferred Stock works more like a hybrid between a stock and a bond: preferred shareholders usually have no voting rights, but they receive a fixed priority dividend before common shareholders get paid.
Is buying individual stocks better than buying an S&P 500 or global index fund?
For the vast majority of beginners and busy professionals, a broad index ETF is far safer and more reliable. S&P Dow Jones SPIVA scorecards consistently show that over 15-year periods, more than 85% of professional Wall Street fund managers fail to beat the simple S&P 500 index after fees. You can always keep 80% to 90% of your portfolio in a broad index ETF and use the remaining 10% to buy individual companies you know well.
Comments (0)
No comments yet. Be the first to share your thoughts.